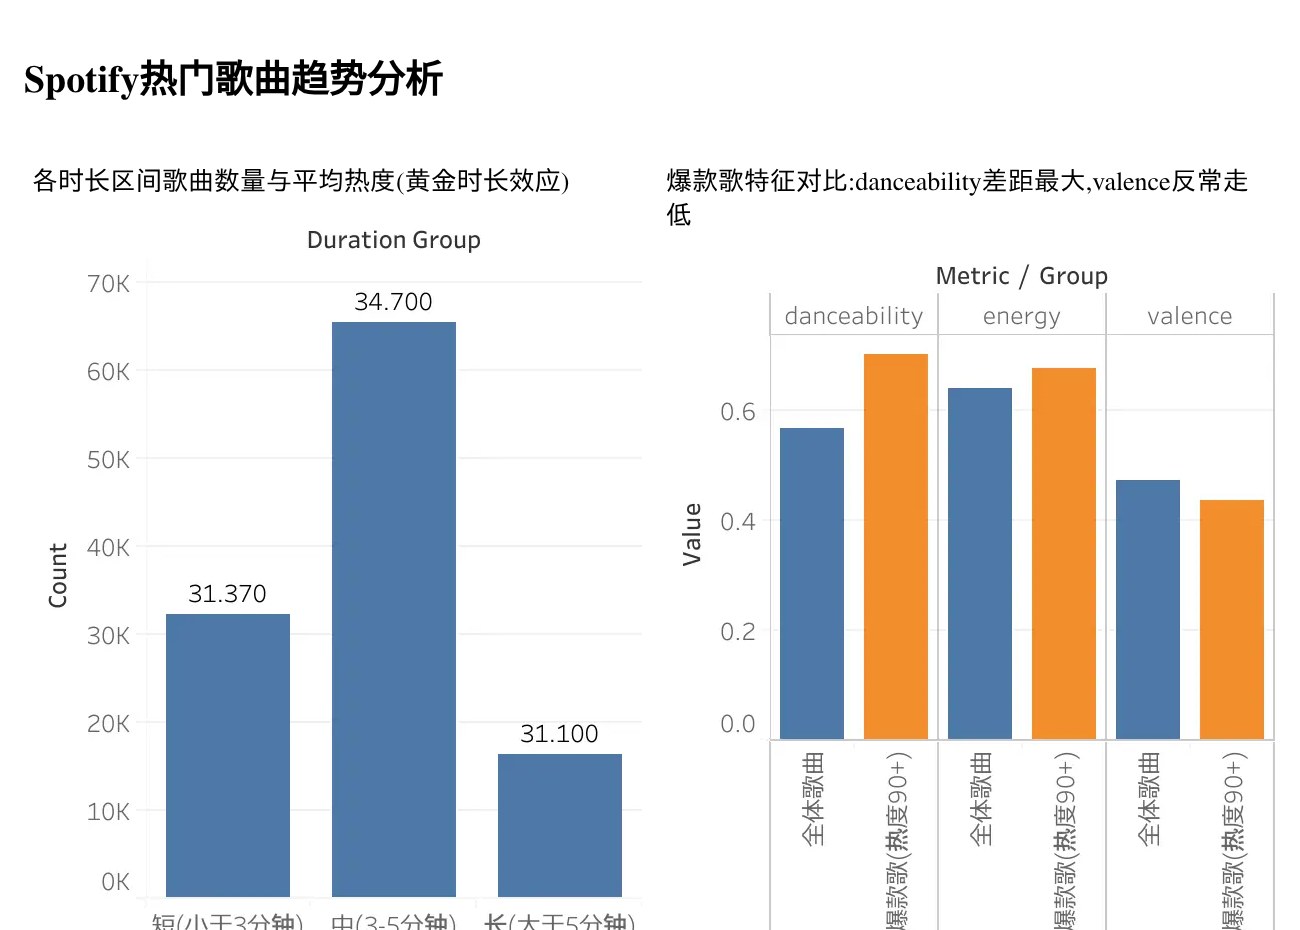
The published Tableau Public dashboard
Data Analysis · SQL + Tableau
Spotify Track Trends
My first end-to-end data analysis project, built from zero SQL knowledge. Around one core question — what drives a track's popularity — I designed ten progressive SQL questions covering genre distribution, popularity drivers, duration effects and audio-feature profiles, then published the findings as a public Tableau dashboard.
- Query optimization: a correlated subquery that hung on 114k rows was rewritten as
RANK() OVER (PARTITION BY …), cutting execution to ~129 ms. - Caught the sampling design: every one of the 114 genres contains exactly 1,000 tracks — a balanced sample, not a market share — which changed how every cross-genre comparison could be read.
- Confounding, flagged: explicit tracks average higher popularity (36.45 vs 32.94), but with skewed sample sizes and genre concentration, I stated the limitation instead of claiming causation.
- Findings with business meaning: a “golden duration” inverted-U (3–5 min tracks are 57% of the set and peak in popularity), and a hit-song profile where danceability beats valence — hits are rhythmic, not cheerful.
Next project
People Living in Order →